Iran’s economy has faced recurring existential crises since the 1979 revolution. Tehran suffered the biggest shocks from the sapping costs of an eight-year war with Iraq, between 1980 and 1988, and the wave of international sanctions imposed in 2012. During less volatile years, Iran’s economic indicator -- gross domestic product and per capita income -- did increase. But corruption and gross mismanagement undermined growth. The Islamic Republic was consistently burdened by chronic unemployment and inflation. When he took office in 2013, President Hassan Rouhani acknowledged, "The previous government was the wealthiest and most indebted government" since the 1979 revolution.

Iran had expected to reap significant economic benefits as part of the 2015 nuclear deal reached with the world’s six major powers. But the U.S. withdrawal from the agreement and subsequent reimposition of sanctions in 2018 hampered Iran’s ability to conduct business and attract investment.
On February 6, Parliamentary Speaker Ali Larijani announced that Supreme Leader Ayatollah Ali Khamenei had ordered the government to "reform the country's structure" within four months. "This may lead to reforming the national budget [for the upcoming Iranian year], which will be pursued after work on the budget in the parliament is completed," said Larijani. The following is an overview of key economic indicators.
Growth and Inflation
After the 1980-1988 war with Iraq, Iran’s GDP gradually increased over the next two decades. In 2012, however, international sanctions disrupted the growth trend.
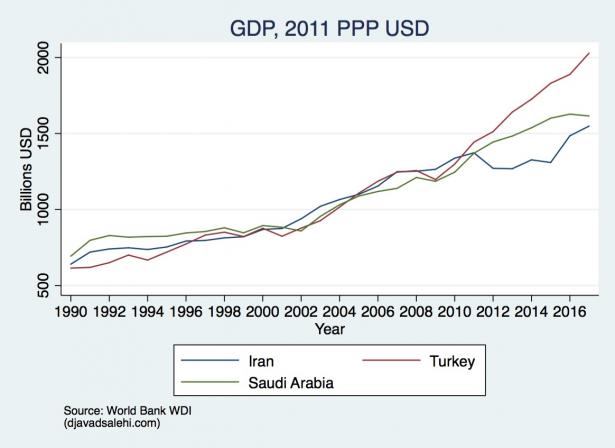
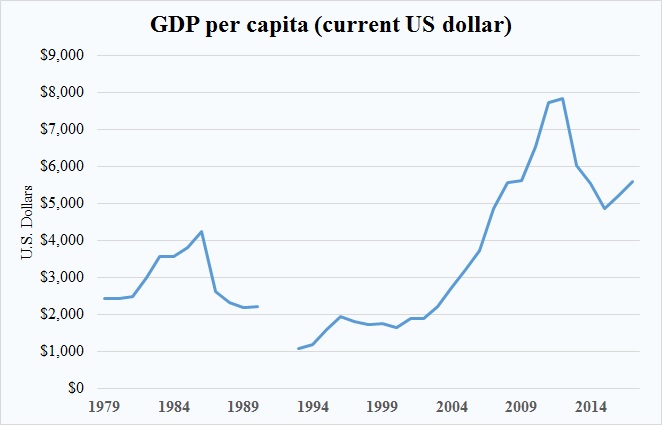
Source: World Bank national accounts data, and OECD National Accounts data files
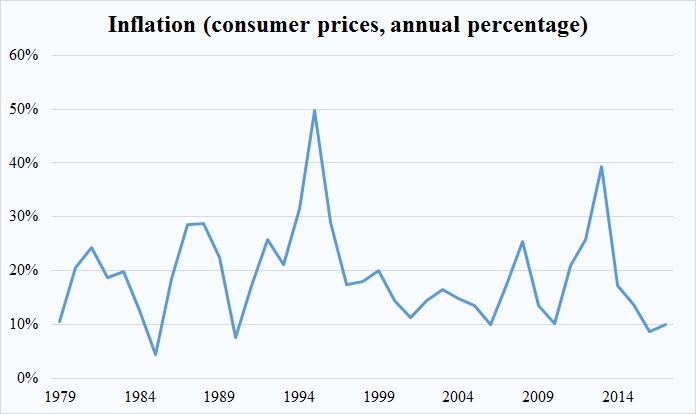
Source: International Monetary Fund, International Financial Statistics and data files.
Currency Devaluation (rials per U.S. dollar)
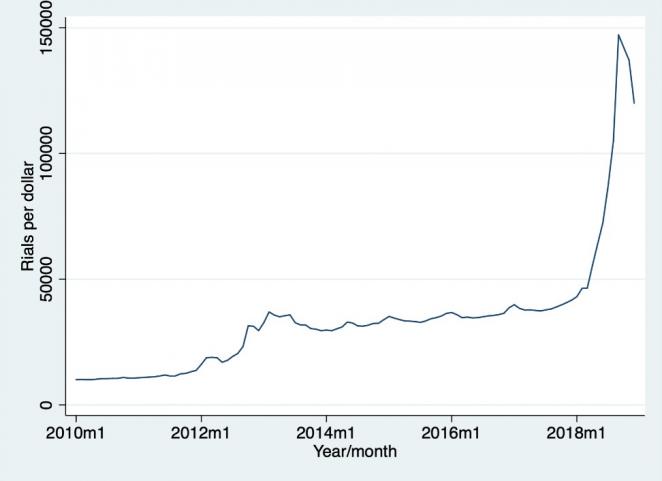
Credit: Graph by Djavad Salehi-Isfahani
Source: The Central Bank of Iran and http://www.bonbast.com for late 2018 (accessed November 24, 2018).
Official Military Expenditure
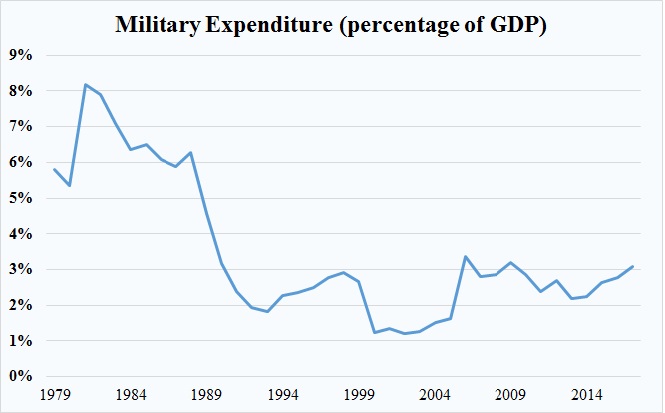
Source: Stockholm International Peace Research Institute (SIPRI), Yearbook: Armaments, Disarmament and International Security
Employment
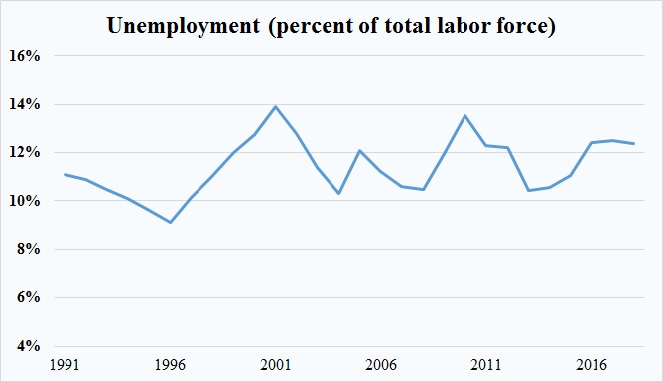
Source: International Labour Organization, ILOSTAT database. Data retrieved in September 2018.
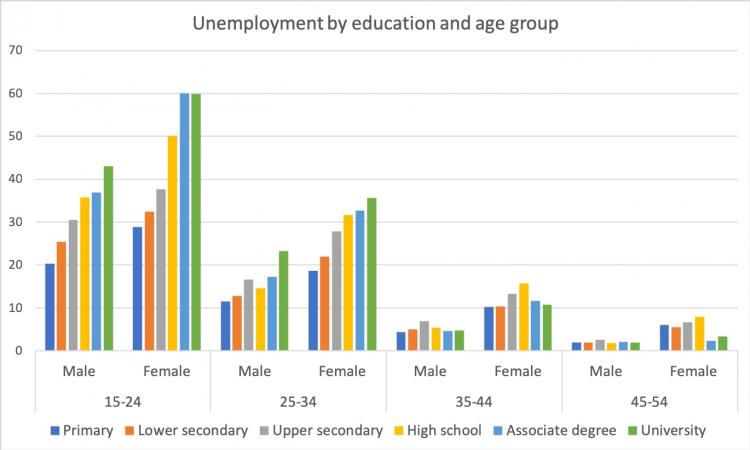
Credit: Graph by Djavad Salehi-Isfahani
Source: 2-percent sample of the 2016/2017 national census (Statistical Center of Iran)
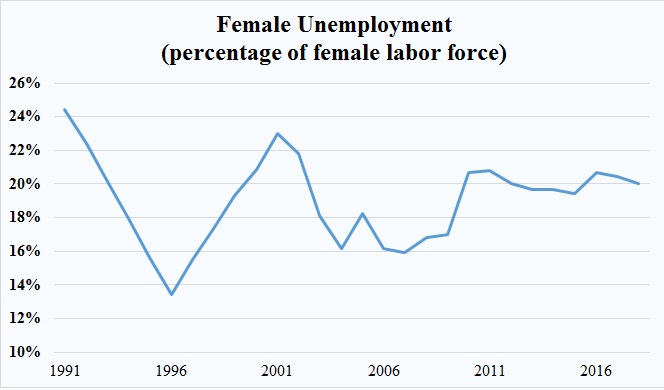
Source: International Labour Organization, ILOSTAT database. Data retrieved in September 2018.
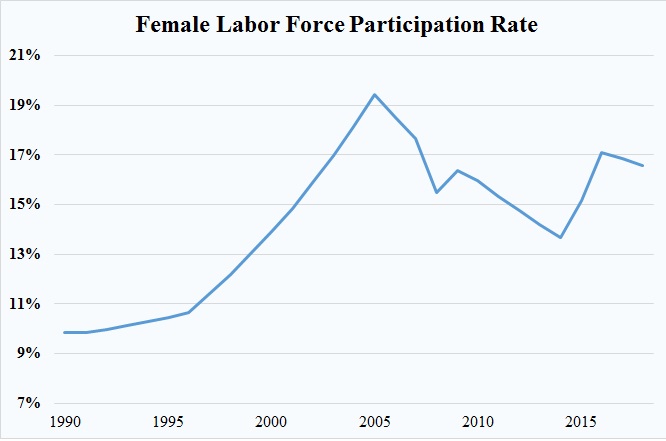
*Percentage of female population ages 15+
Source: International Labour Organization, ILOSTAT database. Data retrieved in September 2018
Oil Exports and Production
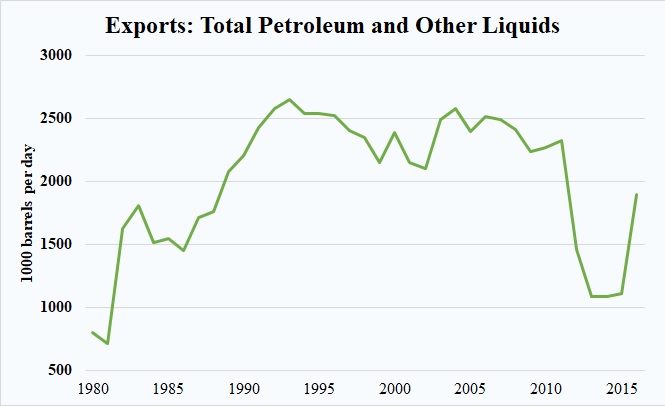
Source: U.S. Energy Information Administration

Source: U.S. Energy Information Administration, Short-Term Energy Outlook, October 2018; ClipperData
Note: Liquid fuels production includes crude oil, lease condensate, hydrocarbon gas liquids, biofuels, and refinery processing gain.
The United States withdrew from the nuclear deal in May 2018 and reimposed oil sanctions in November 2018, triggering a decline in production and exports.
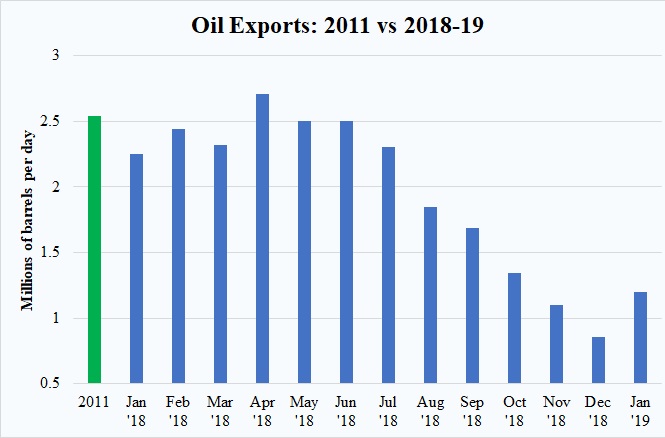
Source: SVB Energy International (data used with permission)
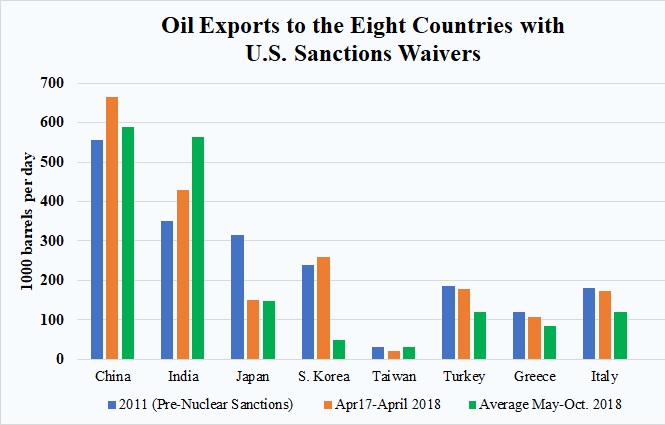
Source: SVB Energy International (data used with permission)
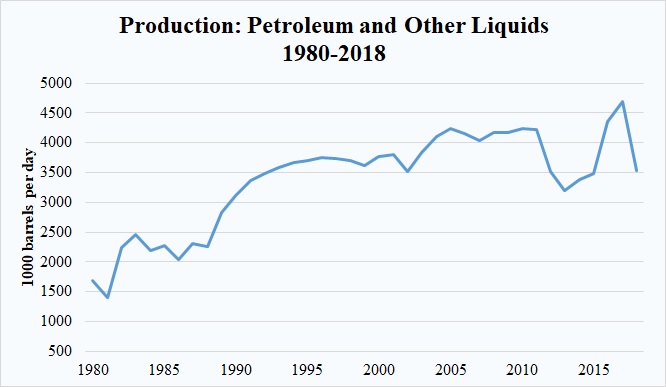
Source: U.S. Energy Information Administration (1980-2017) and SVB Energy International (2018 data used with permission)
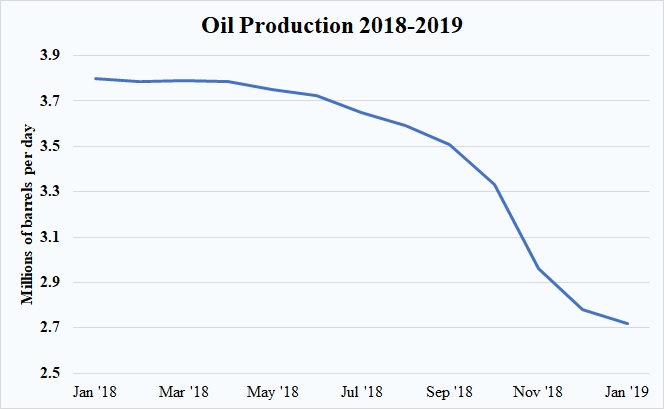
Source: SVB Energy International (data used with permission)
This article is based on research done by Katayoun Kishi, who was a research assistant at the U.S. Institute of Peace in 2016. Garrett Nada, Managing Editor of The Iran Primer, and Maana Azar-Chehr, a research assistant at the Woodrow Wilson International Center for Scholars, also conducted research for this article.
