
Iranian society has undergone dramatic changes since the 1979 revolution. The population has doubled. The Islamic Republic has improved education. Illiteracy has been virtually eradicated. People are living longer.
• Education: In 1976, the adult literacy rate was 37 percent. In 2016, it was 86 percent.
• Urbanization: Most of the population has urbanized. In 1979, just under half of the population lived in urban areas. During the subsequent decades, many moved to cities in search of work. In 2017, nearly three quarters of the population lived in urban areas.
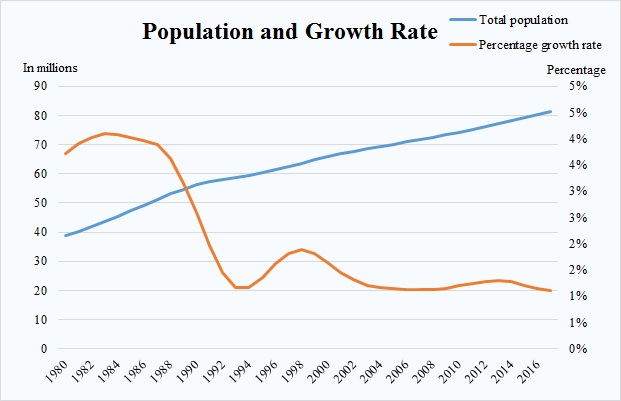
• Population: The population has more than doubled. In 1980, Iran’s population was some 39 million. In 2018, it had reached some 83 million.
• Growth Rate: The population growth rate has declined significantly. In 1980, it was 3.72 percent. In the years following the 1980-1988 war with Iraq, growth slowed significantly. The growth rate has been less than two percent since 1991. In 2017, it was 1.10 percent.
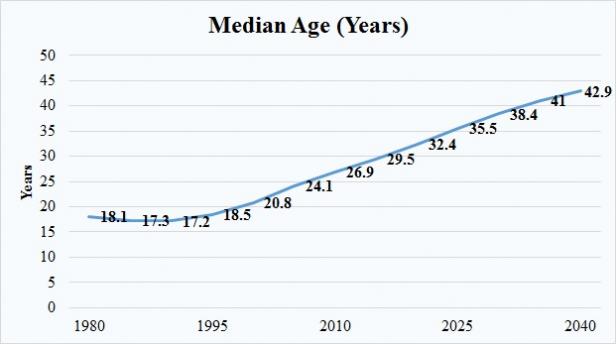
• Median Age: In 1980, the median age was 18. Iran then experienced a baby boom in the first decade after the revolution that nearly doubled the population. The median age has continued to rise as that demographic bulge has aged. In 2015, the media age was just under 30. The median age is projected to rise to nearly 43 by 2040.
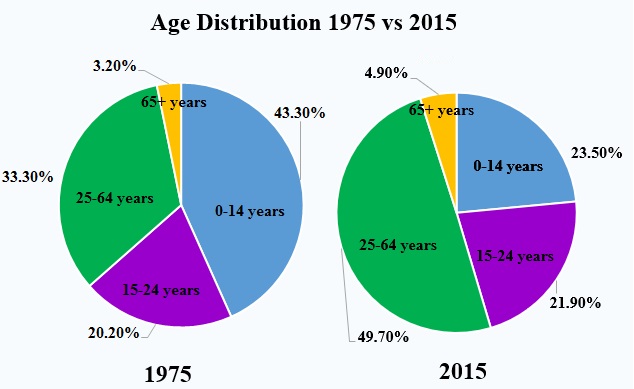
• Age Distribution: In 1975, 43 percent of the population was at or below age 14. In 2015, the same demographic accounted for less than 24 percent of the population. The number of middle aged and elderly individuals has continued to rise.
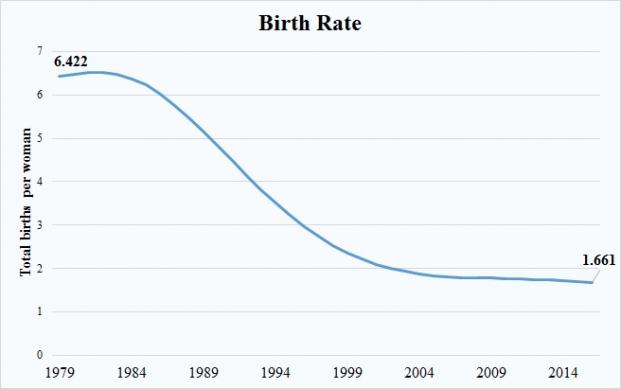
• Birth Rate: In 1979, the average total births per woman was 6.4. In 2016, the average was 1.7 births per woman.
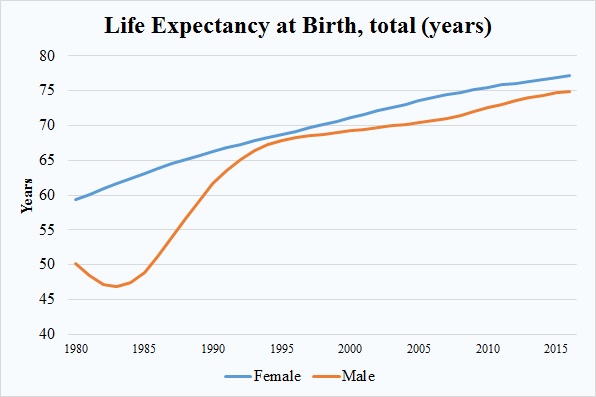
• Life Expectancy: In 1980, male life expectancy was 50 years and female life expectancy was 59 years. In 2016, male life expectancy was 77 years and female expectancy was 75 years.
Education
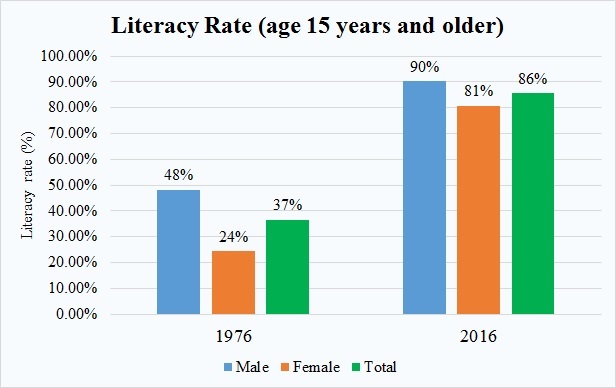
Source: U.N. Educational, Scientific and Cultural Organization
Urbanization
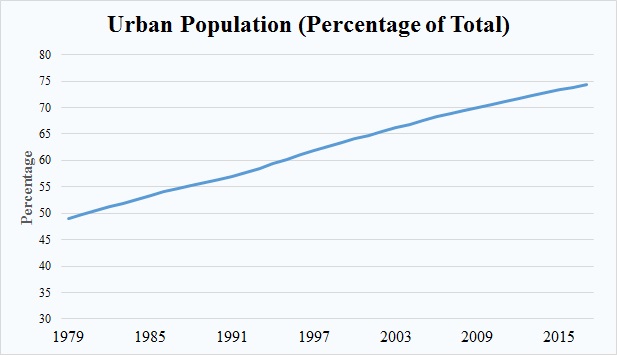
Source: United Nations Population Division. World Urbanization Prospects: 2018 Revision.
Population
Source: U.N. Population Division “World Population Prospects 2017”
Source: U.N. Population Division “World Population Prospects 2017”
Source: U.N. Population Division “World Population Prospects 2017”
In the graph below, the blue line denotes the total population in millions while the orange line denotes the population's percentage growth rate.
Source: U.N. Population Division “World Population Prospects 2017”
Source: United Nations Population Division. World Population Prospects: 2017 Revision.
This article is based on research done by Katayoun Kishi, who was a research assistant at the U.S. Institute of Peace in 2016. Maana Azar-Chehr, a research assistant at the Woodrow Wilson International Center for Scholars, conducted research for this article.